


America's Waterways
A look at the how water is distributed throughout the United States. By the numbers, with a focus on the South.

America’s waterways play important roles in all of our lives. They provide venues for recreation, cultural connection and just general well-being. For most people in the country, these are probably the biggest things that come to mind when they think of waterways
But the waterways also serve very critical commercial and economic purposes. And depending on where you live in the country, understandings of those parts can vary significantly.
In a previous article over in the Stories About Place section, I went through how gaining access to the Mississippi River’s waterway system was the primary driver of the Louisiana Purchase. Maritime trade was a major contributor to America’s early growth to the east and the Louisiana Territory’s addition enhanced the nation’s maritime potential 100-fold.
The Army Corps of Engineers estimates that the country’s inland waterway system contains close to 25,000 miles, with approximately 12,000 being commercially navigable. The system components that the agency are responsible for carry a sixth of intercity cargo volume and account for 25% of the nation’s foreign trade.
I’ve spent most of my life living in close proximity to the U.S. waterway system but rarely ever think about it in the big picture. So I’m going to spend some time in the Third Coast Data section trying to paint a more comprehensive quant picture. And of course with a focus on the South.
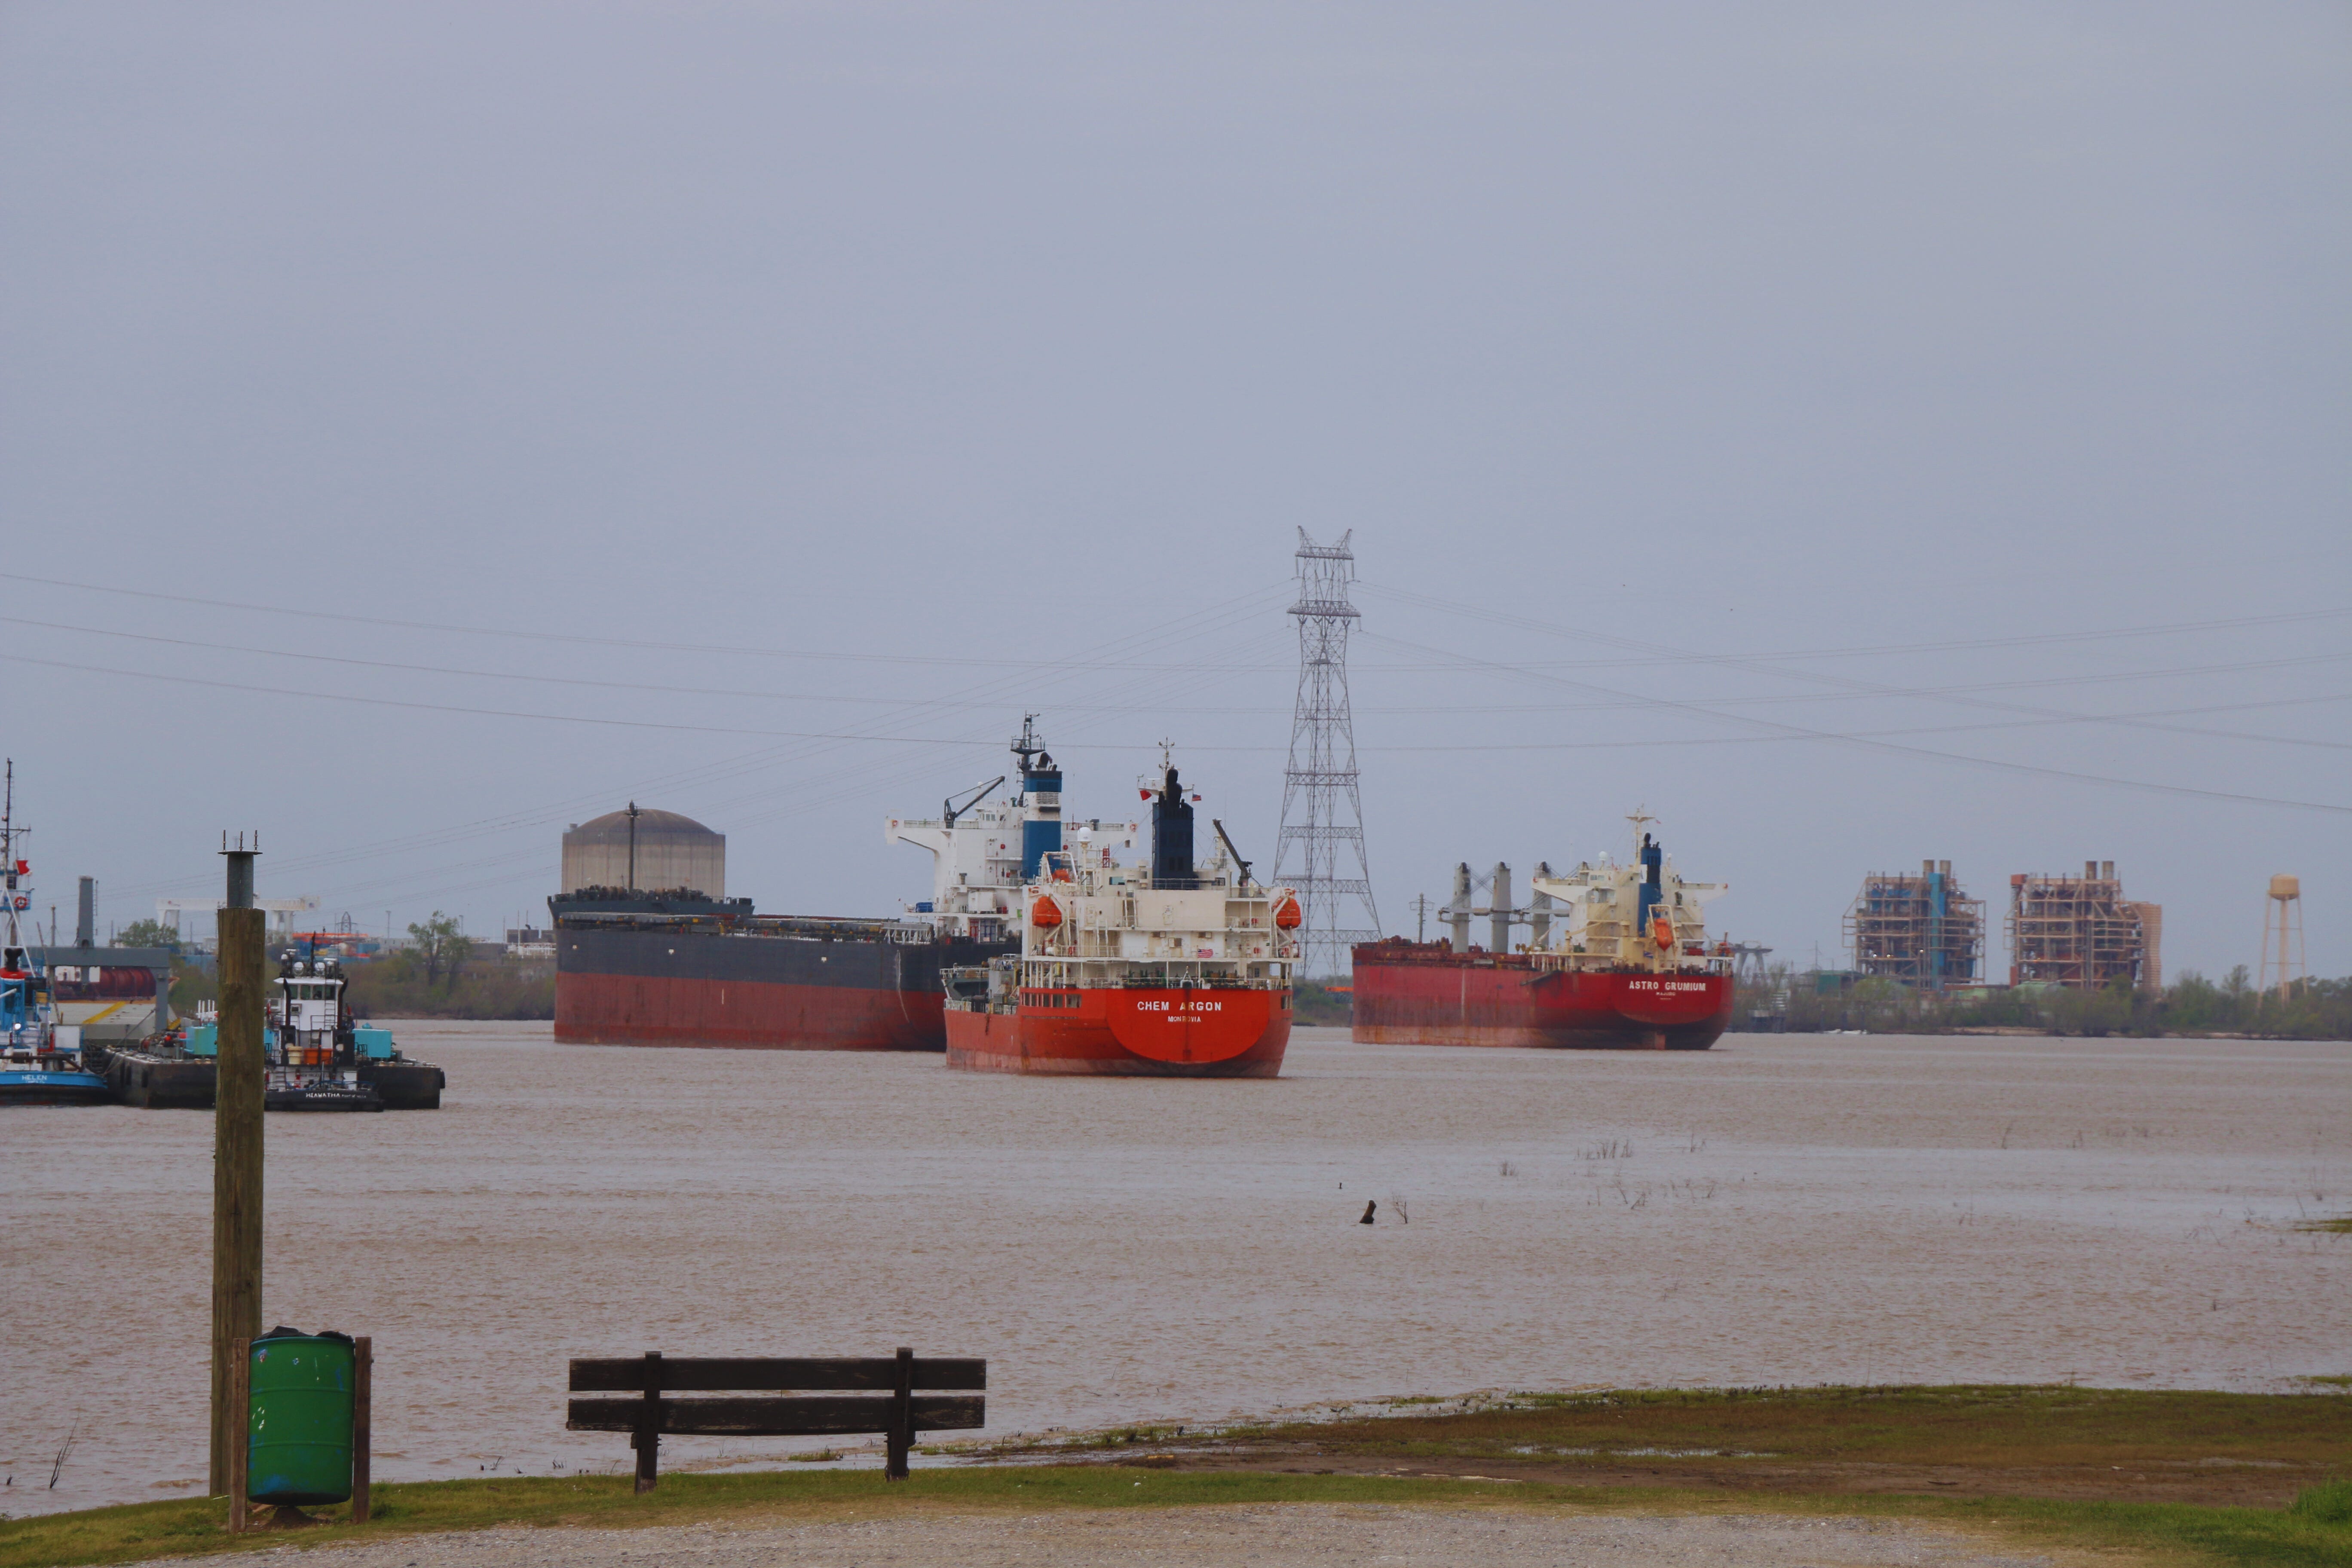
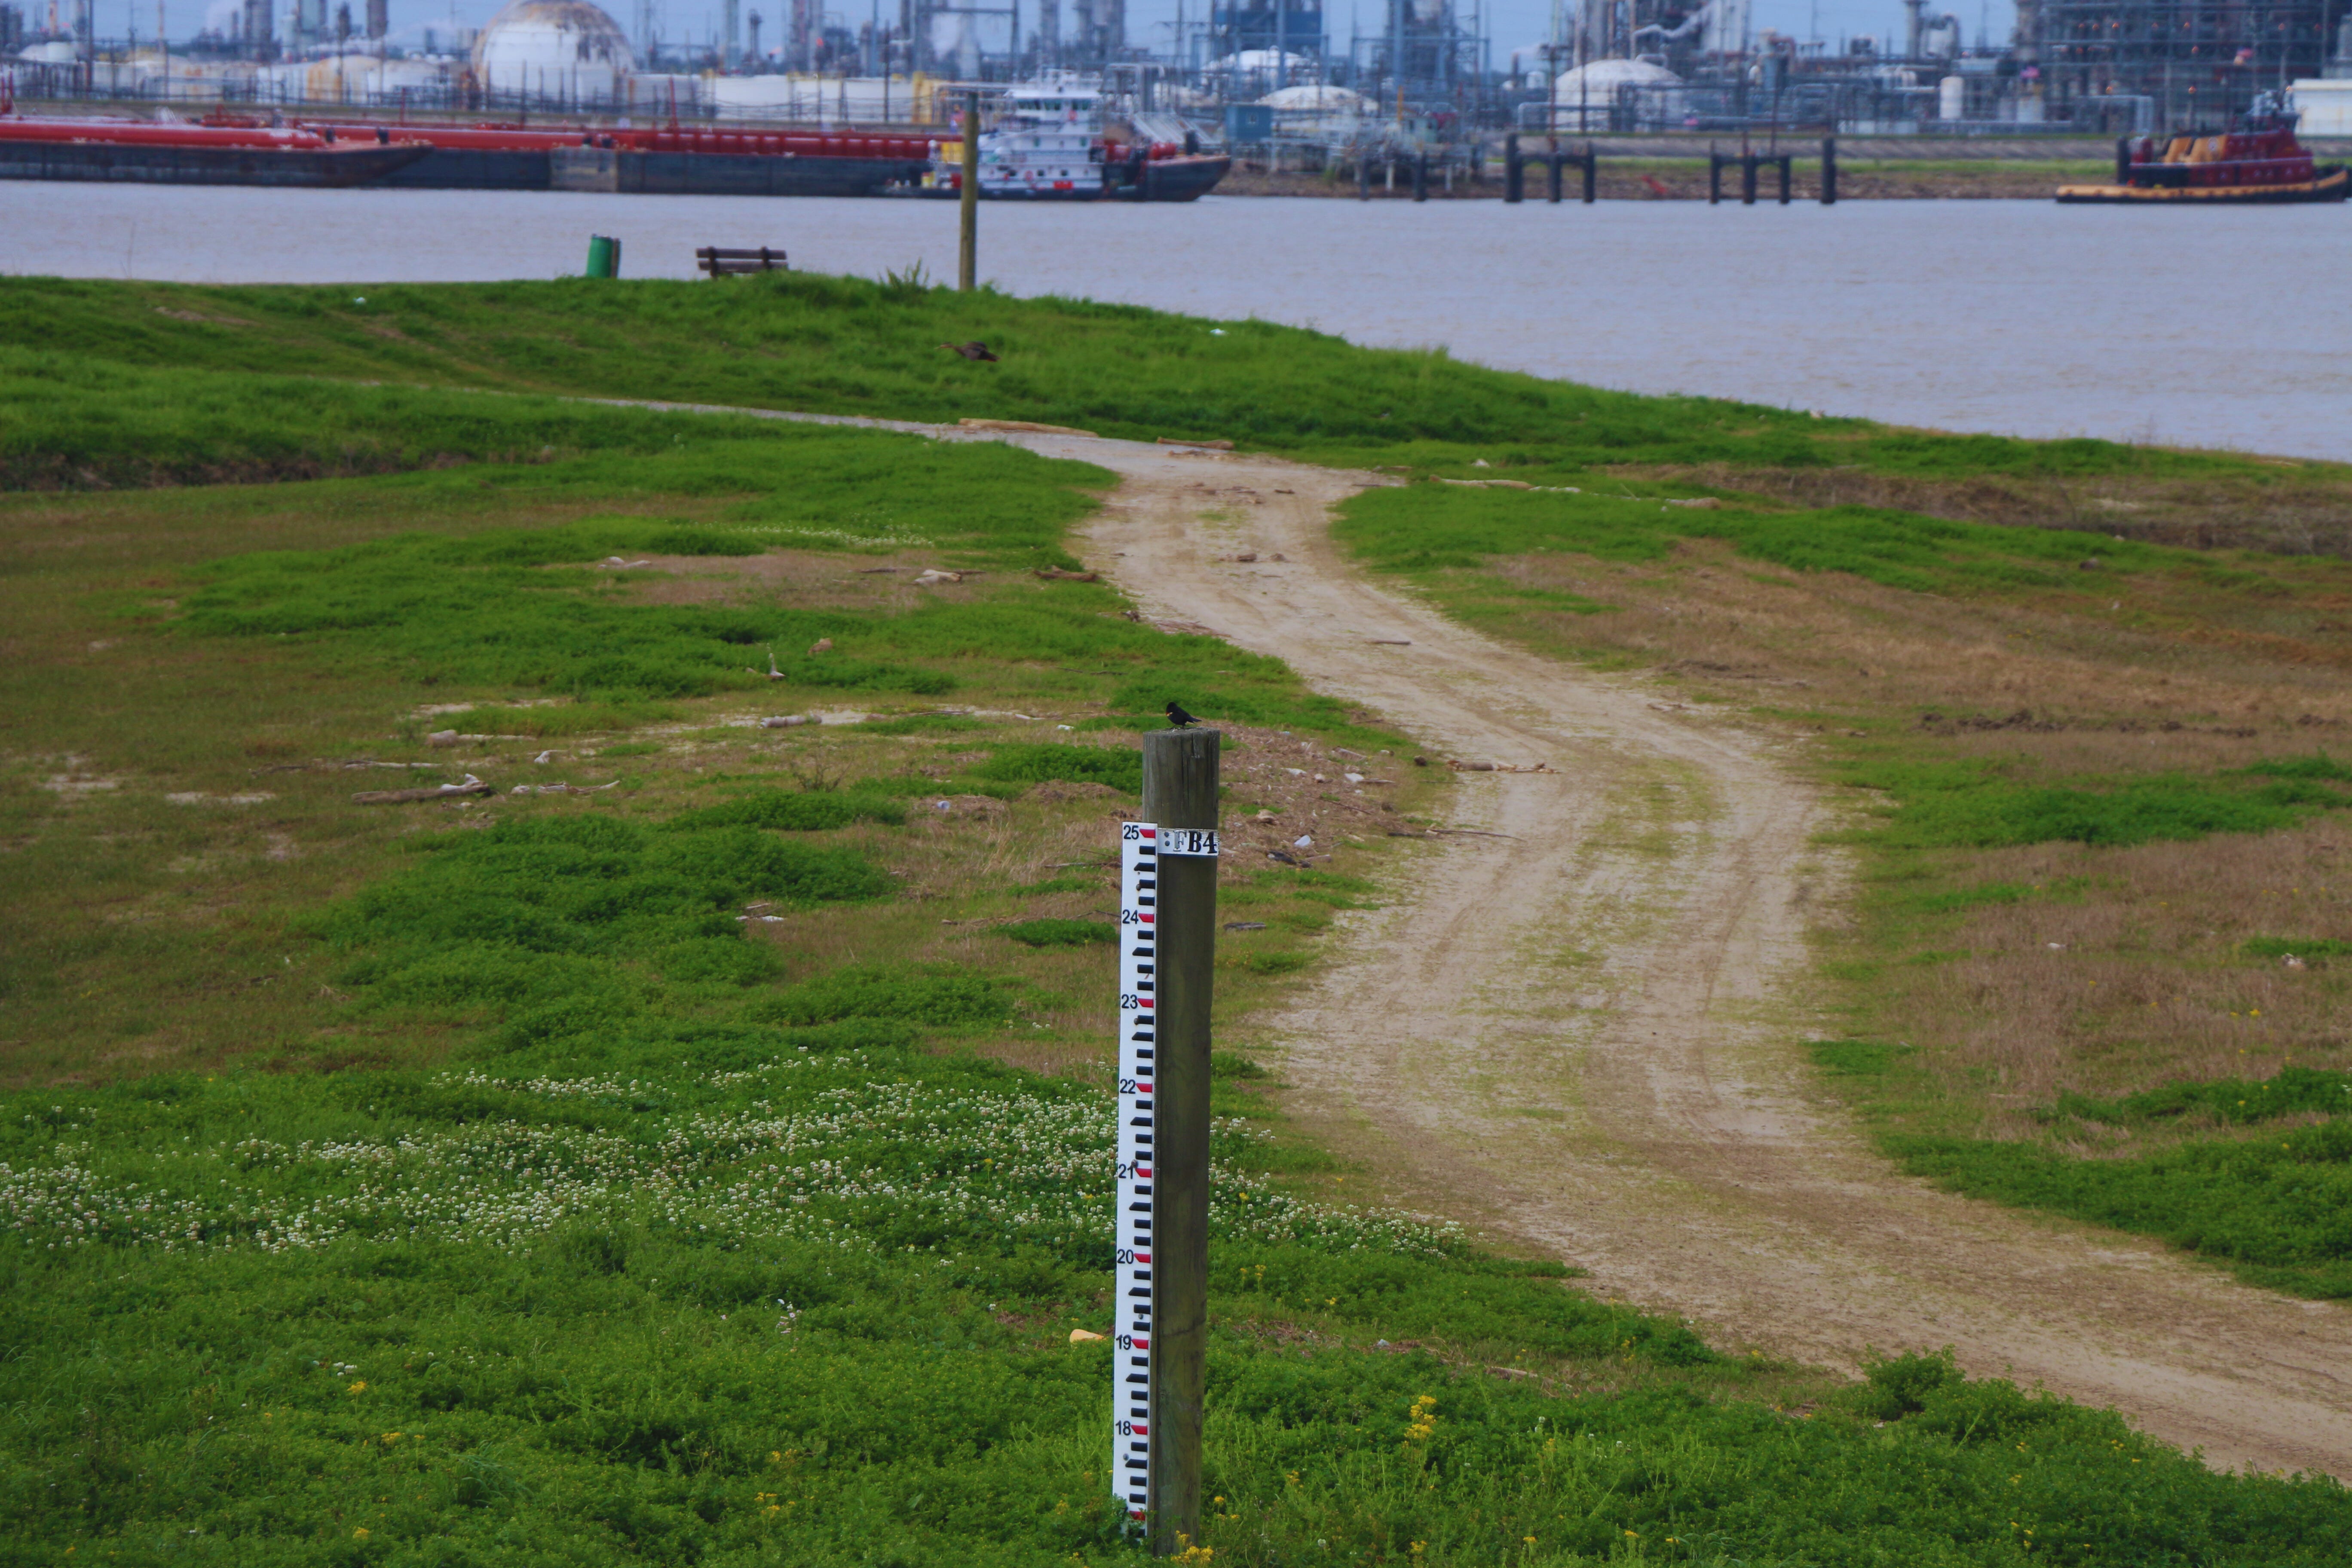
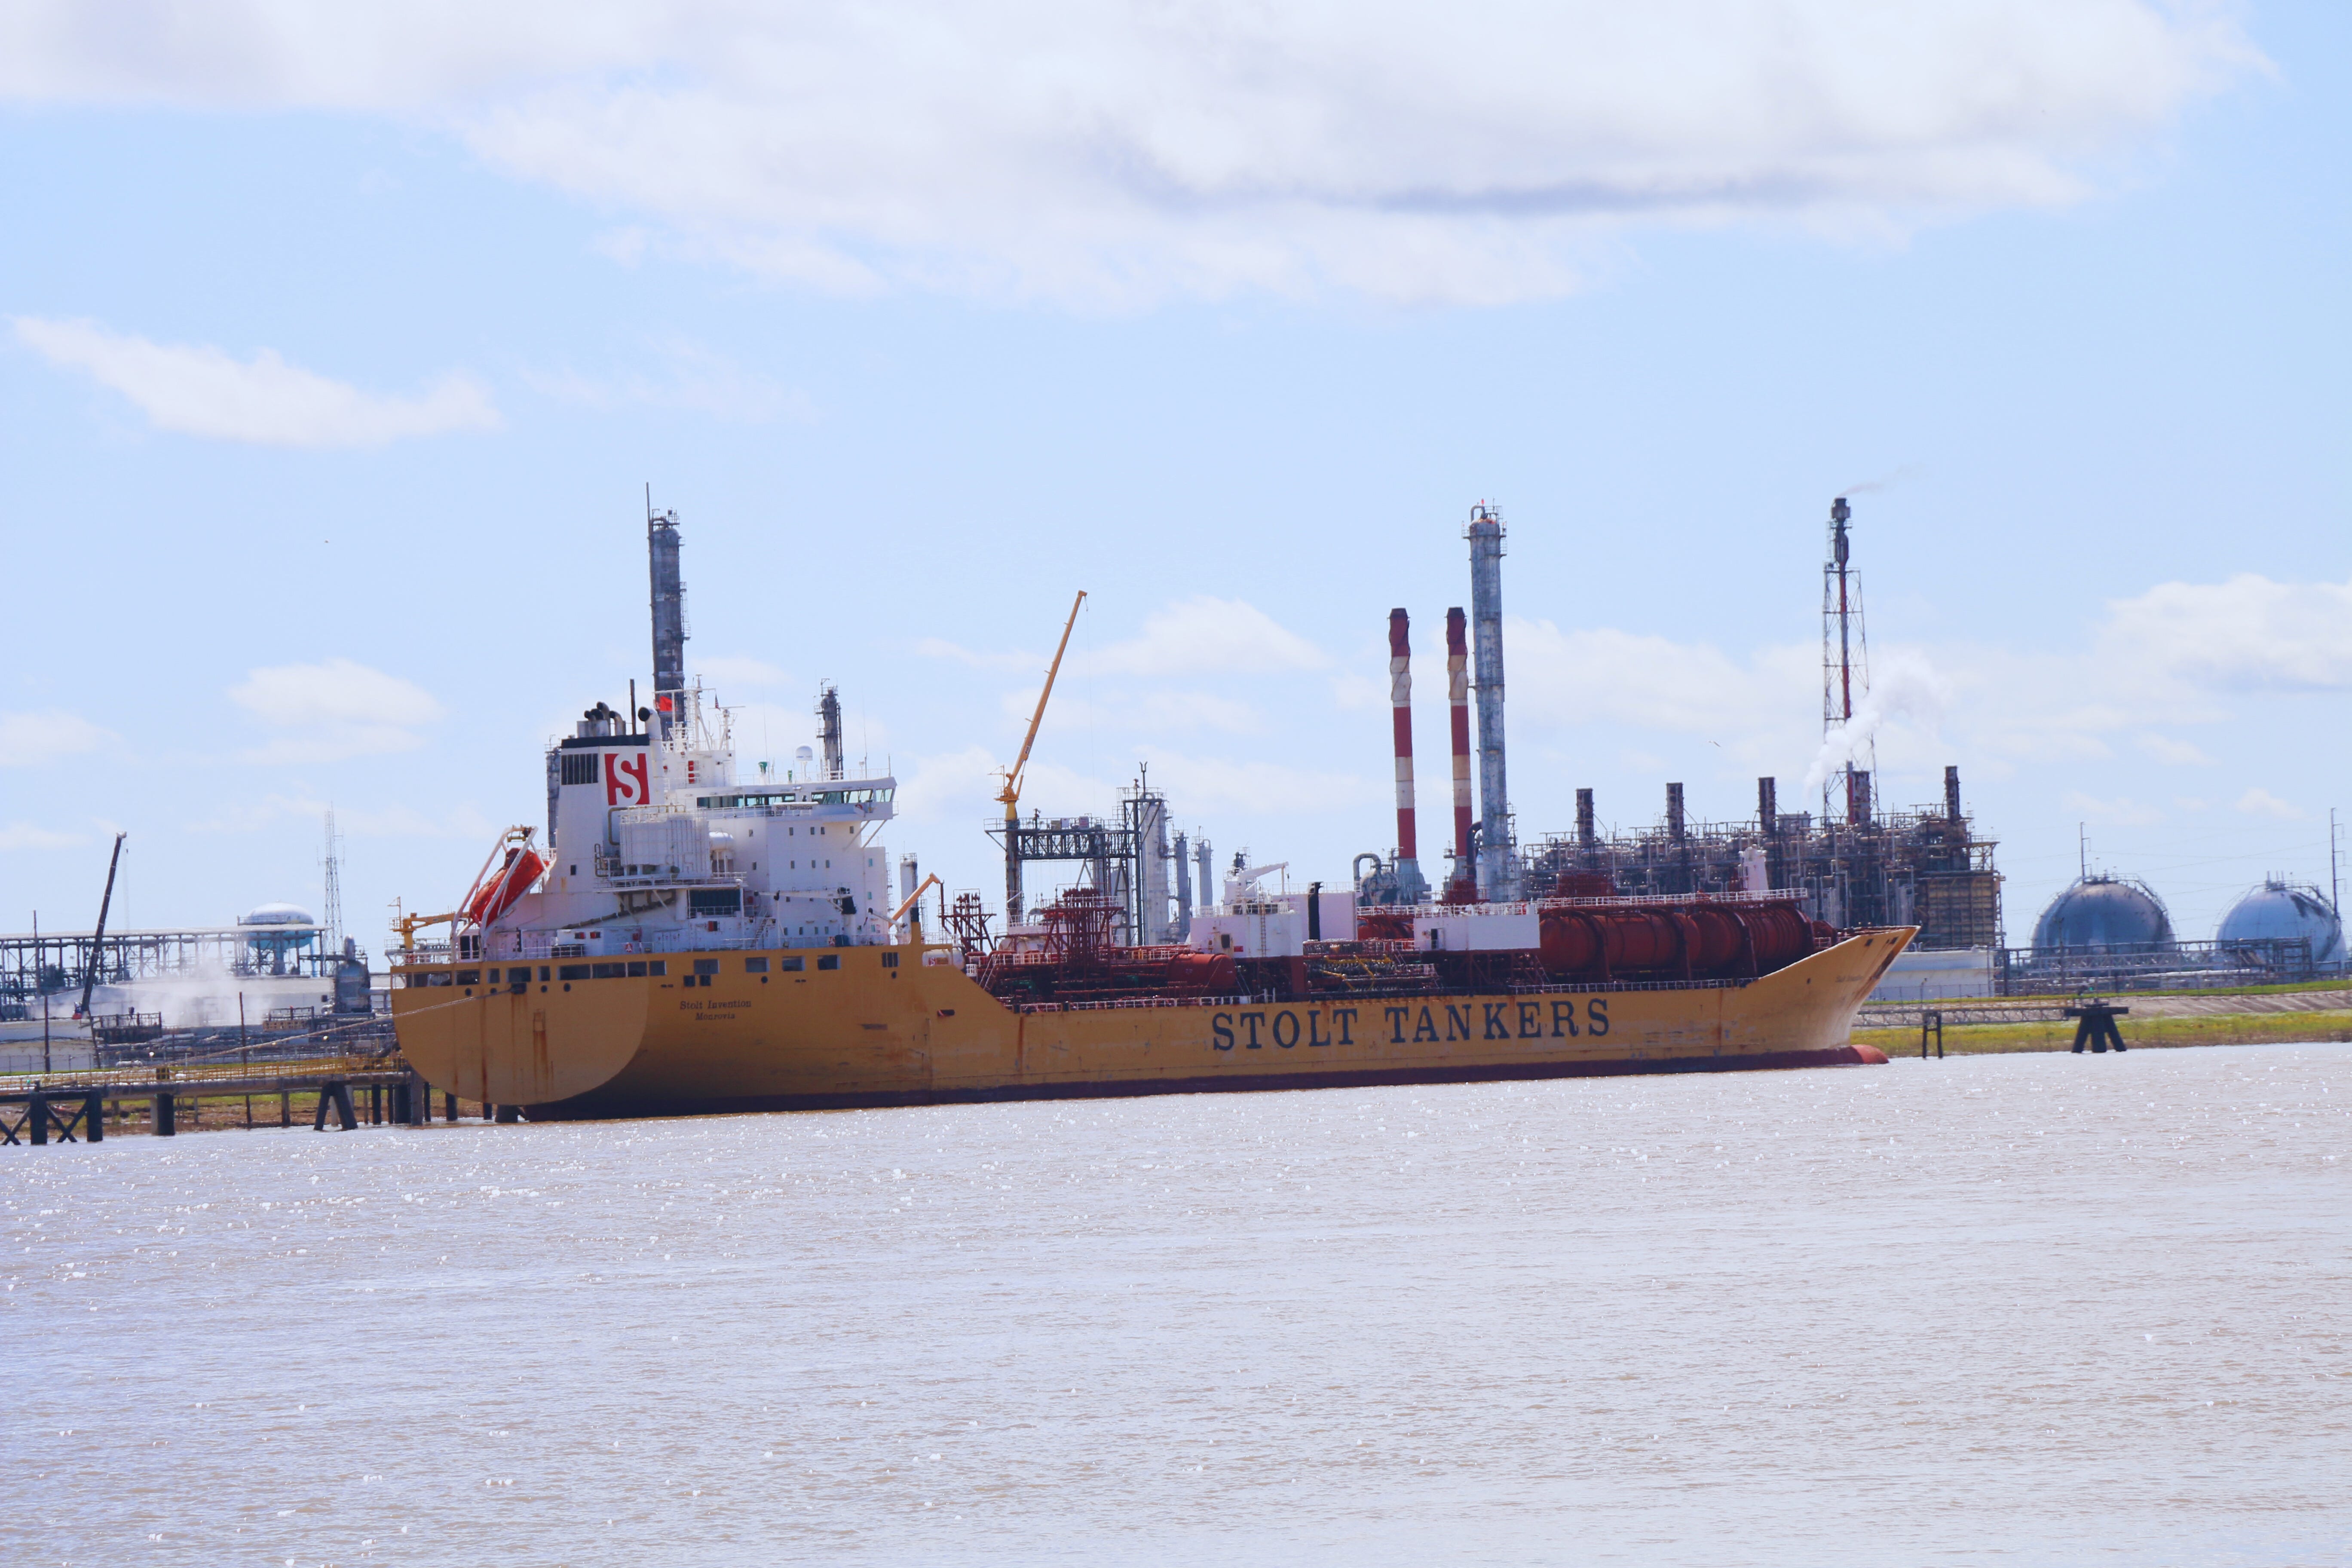
Picking up photography and spending a lot of the last few months along Texas’ Trinity River and the Mississippi River back in Louisiana is also a big reason for this series. Check out my photography site for some of the shots I’ve taken in both places. Particularly along the Waterways.
The focus of this article is providing more context around how water area is distributed throughout the United States. Spoiler alert: it’s not equal.
Regional Context
The U.S. Census Bureau breaks the country up into four regions. And because it’s particularly relevant for this analysis, I include the Territories into the dataset as a fifth group.
The South has the most states (including the District of Columbia), 17. The West has 13, the Midwest sits in the #3 slot with 12 states and the Northeast has nine states.

Total Area
The West
The Western states dominate in terms of total area. The group contains approximately 1,873,253 square miles of total area and Alaska is the giant outlier both within the region and nationally. Alaska’s total area sits at around 665,384 square miles. That translates to 35% of the West’s total area and 17% of nation’s area. Even removing Alaska, though, the West still has the largest collective area footprint, with 1,207,869 square miles.
Everyone Else
The Southern states are #2 in terms of total area with 920,446 square miles and Texas accounts for 29% of that total. The Midwest isn’t far behind with 821,726 square miles of total area. There’s a significant drop-off before you get to the Northeast. Those nine states only have 181,319 square miles of total area. And the five U.S. territories included in this dataset possess 9,186 square miles of total area.

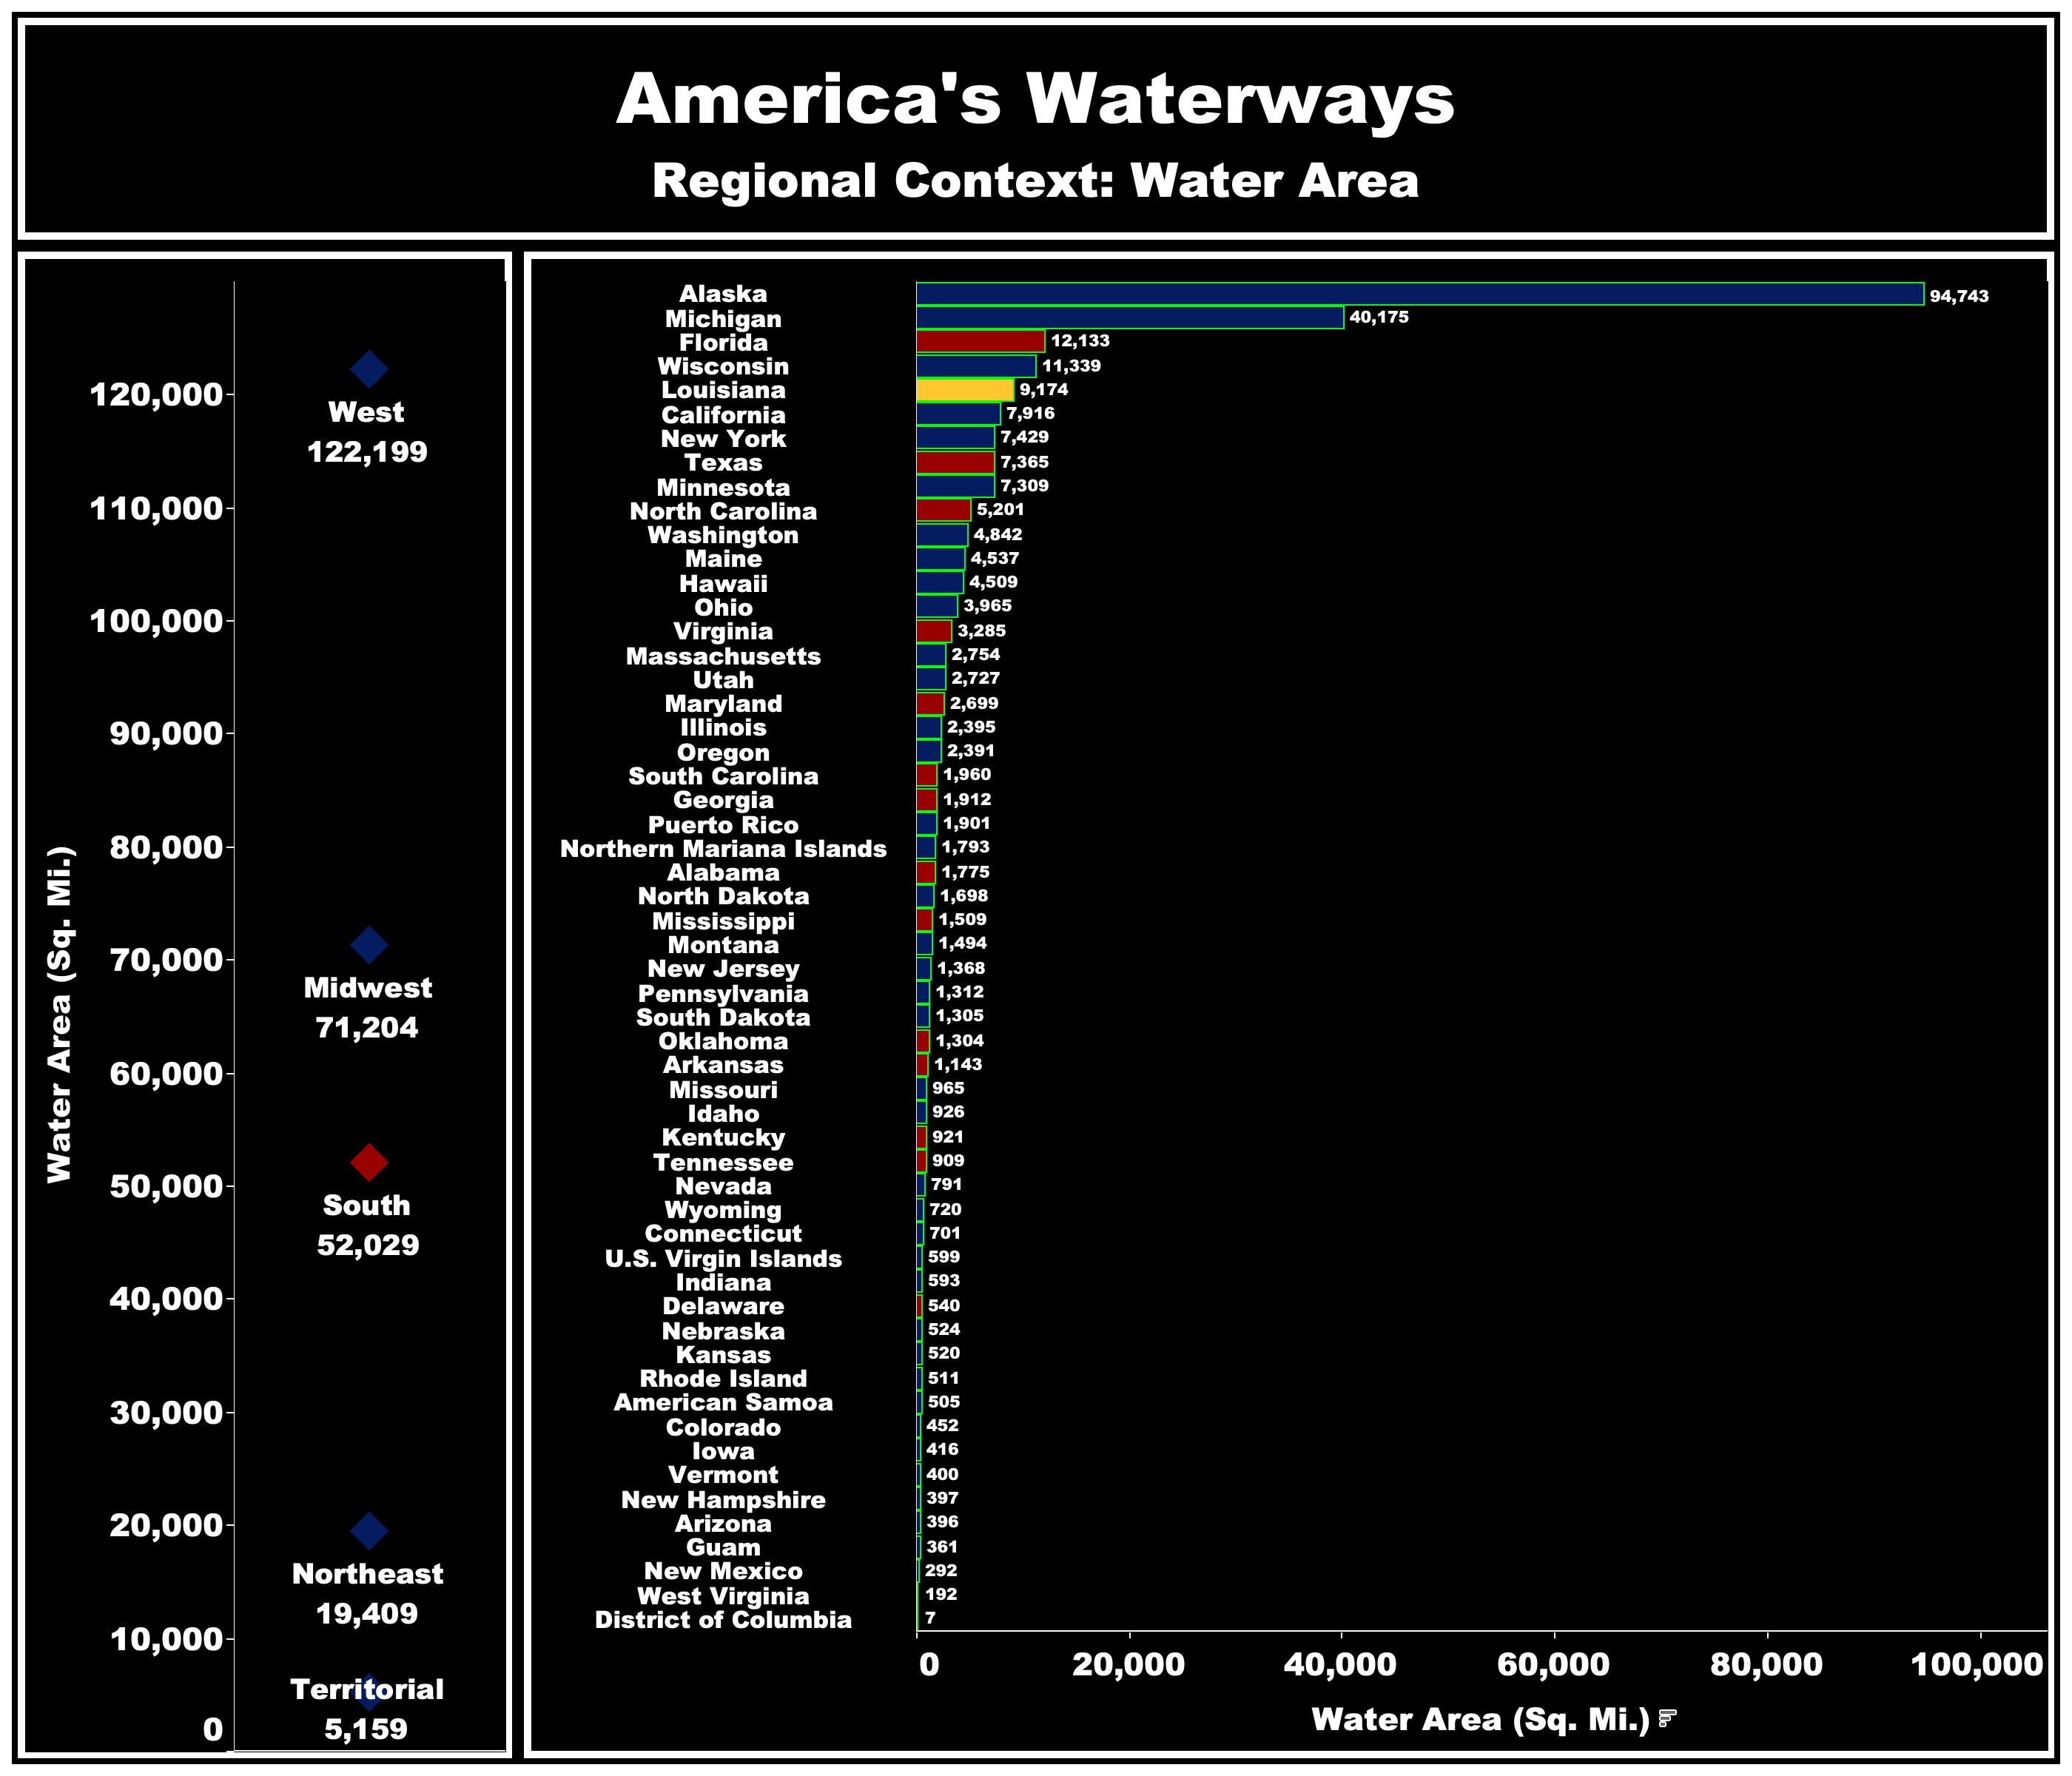
Water Area
The West
The regional distribution changes slightly when you drill down to water area. The West sits at the top again, with 122,199 square miles of water area. And Alaska accounts for 94,743 square miles (77%) of that collective water area.
Everyone Else
The Midwest jumps to the #2 spot, mostly due to Michigan. The 12 Midwest states possess around 71,204 square miles of water area and the peninsular state of Michigan accounts for 40,175 square miles (56%) of that total.
Definition: Peninsular - a portion of land nearly surrounded by water and connected with a larger body by an isthmus.
The South has 52,029 square miles of water area, the Northeast has 19,409 miles and the Territories have 5,159 square miles.
Water Area Share
Things look drastically different from a water area share perspective. And by that I mean the percentage of state’s total area that is water. The five Territories are significant outliers, occupying five of the seven top state spots.
Territories
Northern Mariana Islands = 90.7%
American Samoa = 86.9%
U.S. Virgin Islands = 81.7%
Guam = 63.2%
Puerto Rico = 35.7%
The Northeast
And the Northeast leaps to the front among the contiguous regions. Fourteen percent of the group’s total area is water, with Rhode Island (33.1%) and Massachusetts (26.1%) sitting at the top of the group.
Everyone Else
The South again occupies the #2 regional spot, excluding the Territories, with 8% of states’ total area being water. The Midwest group is not far behind, with a 7.4% water share and the West sits at the bottom with a 6% water share.

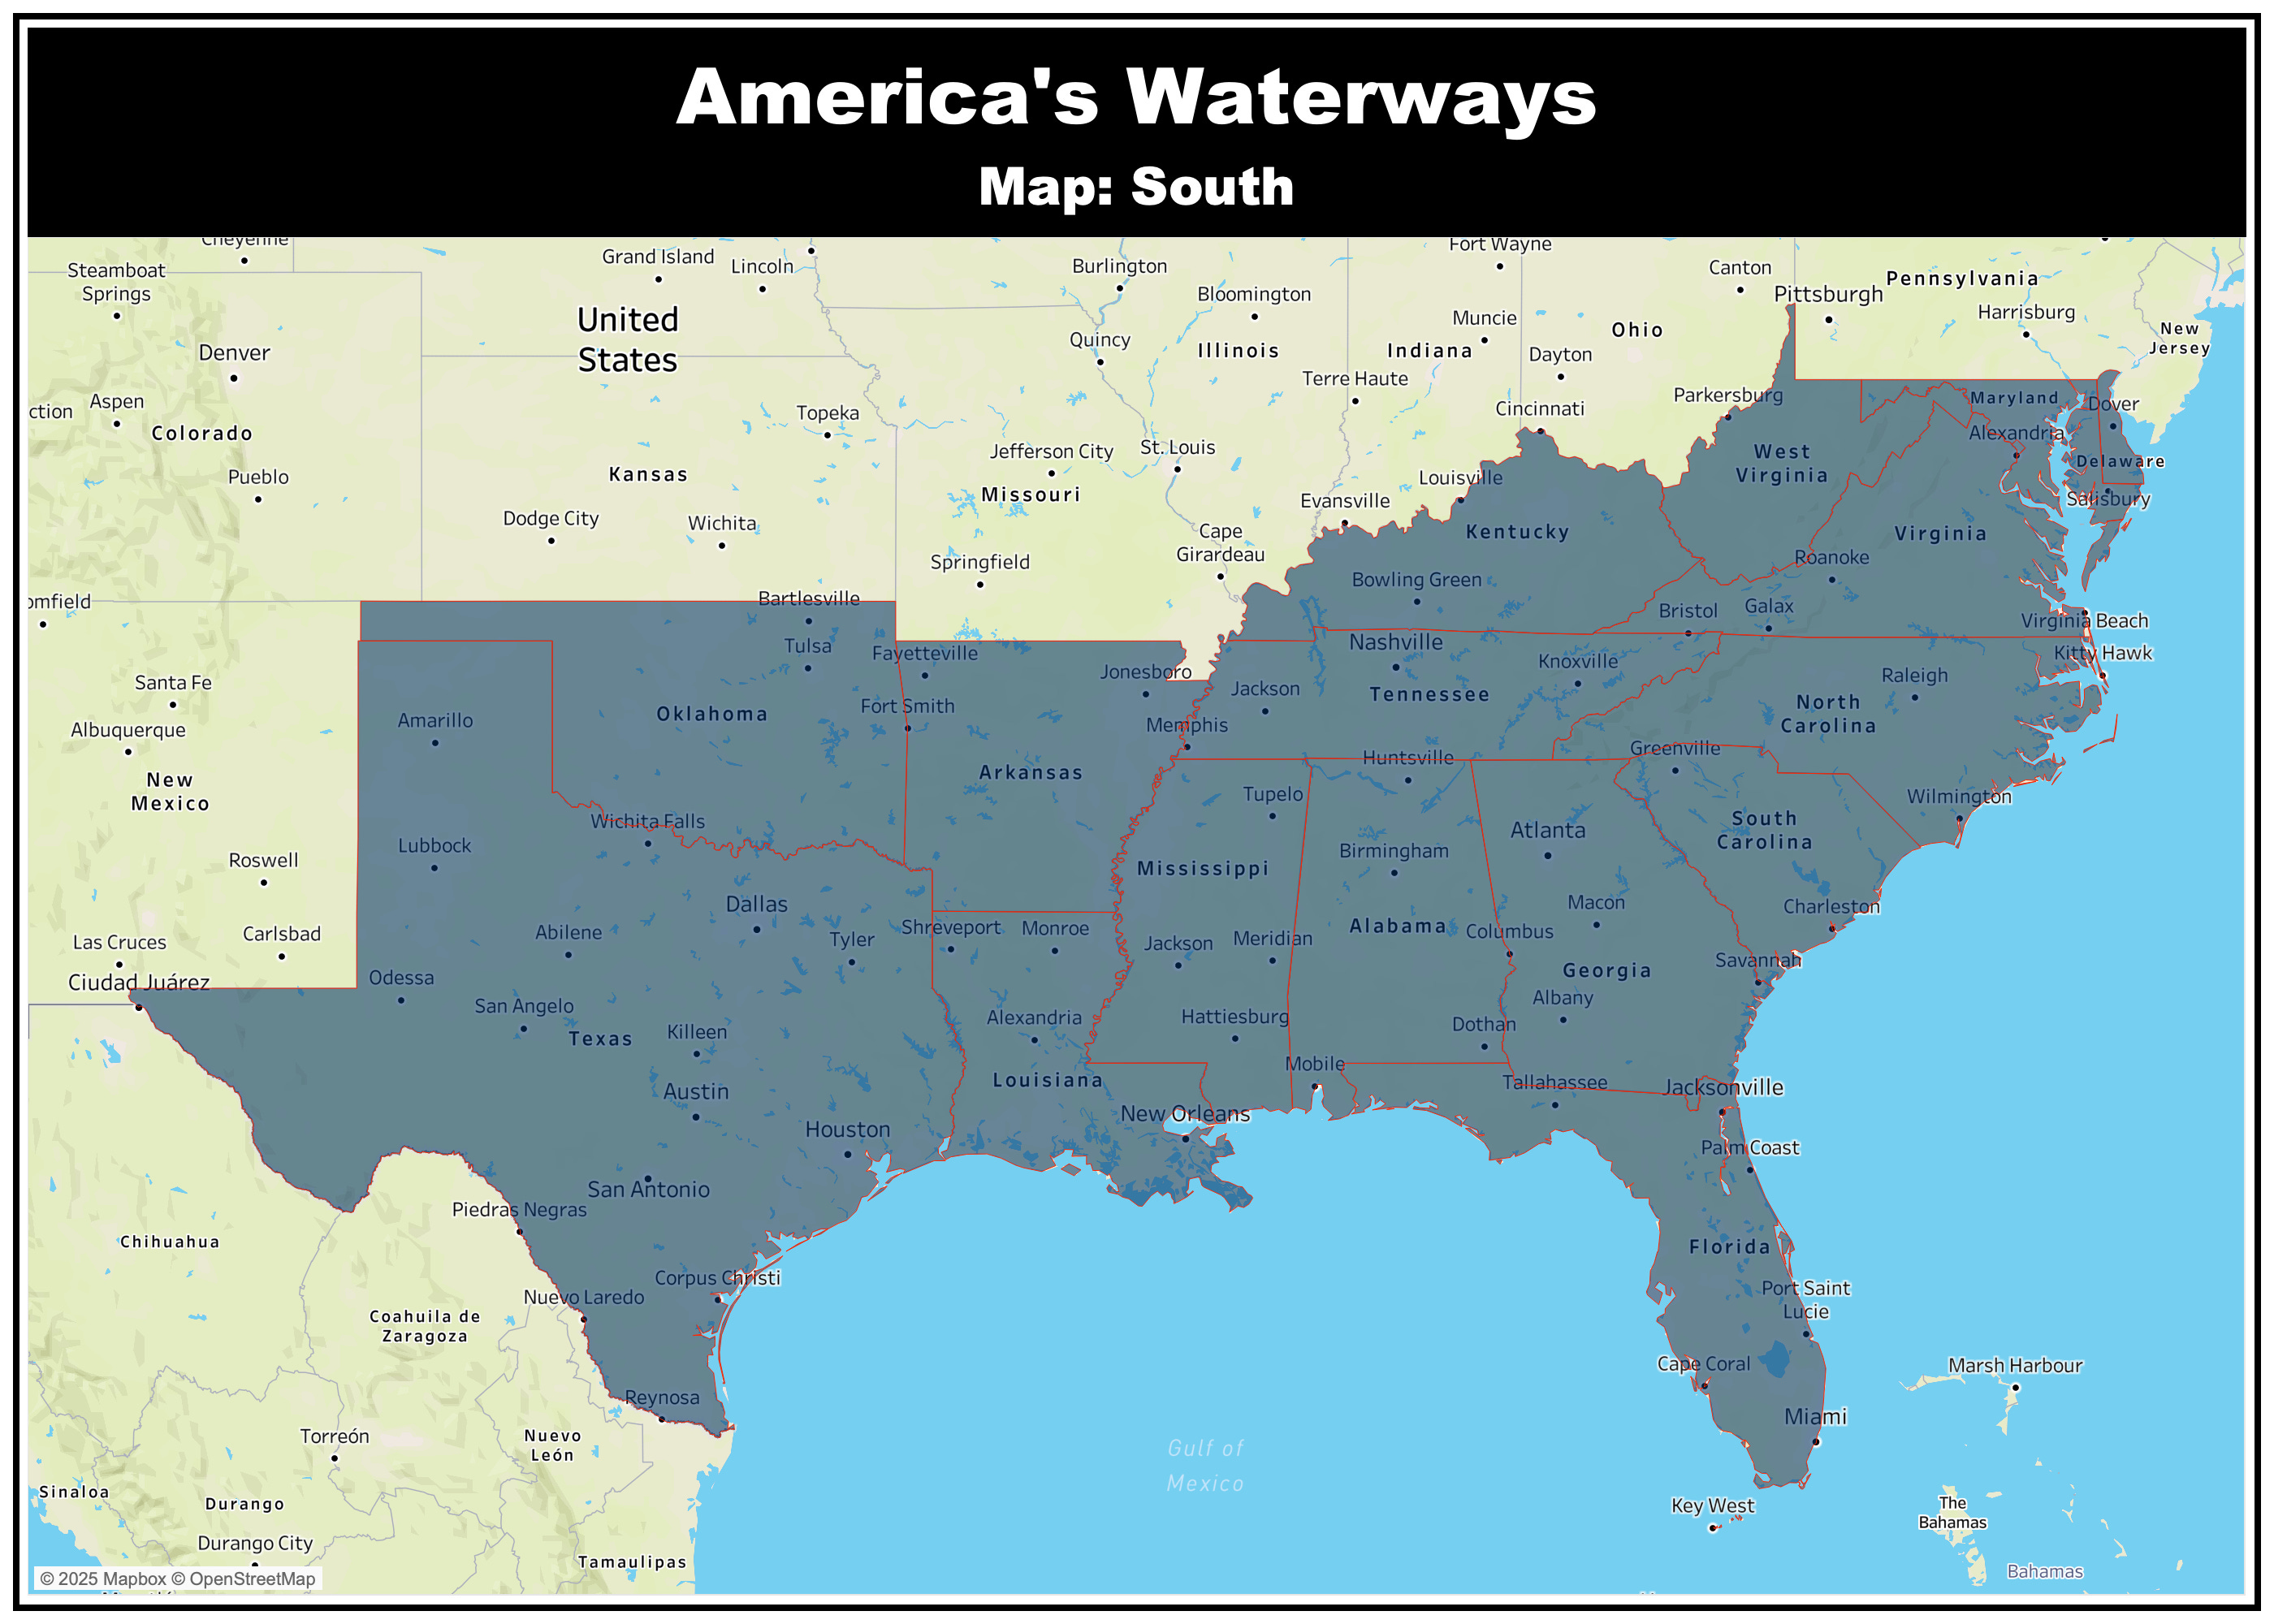
Southern Context
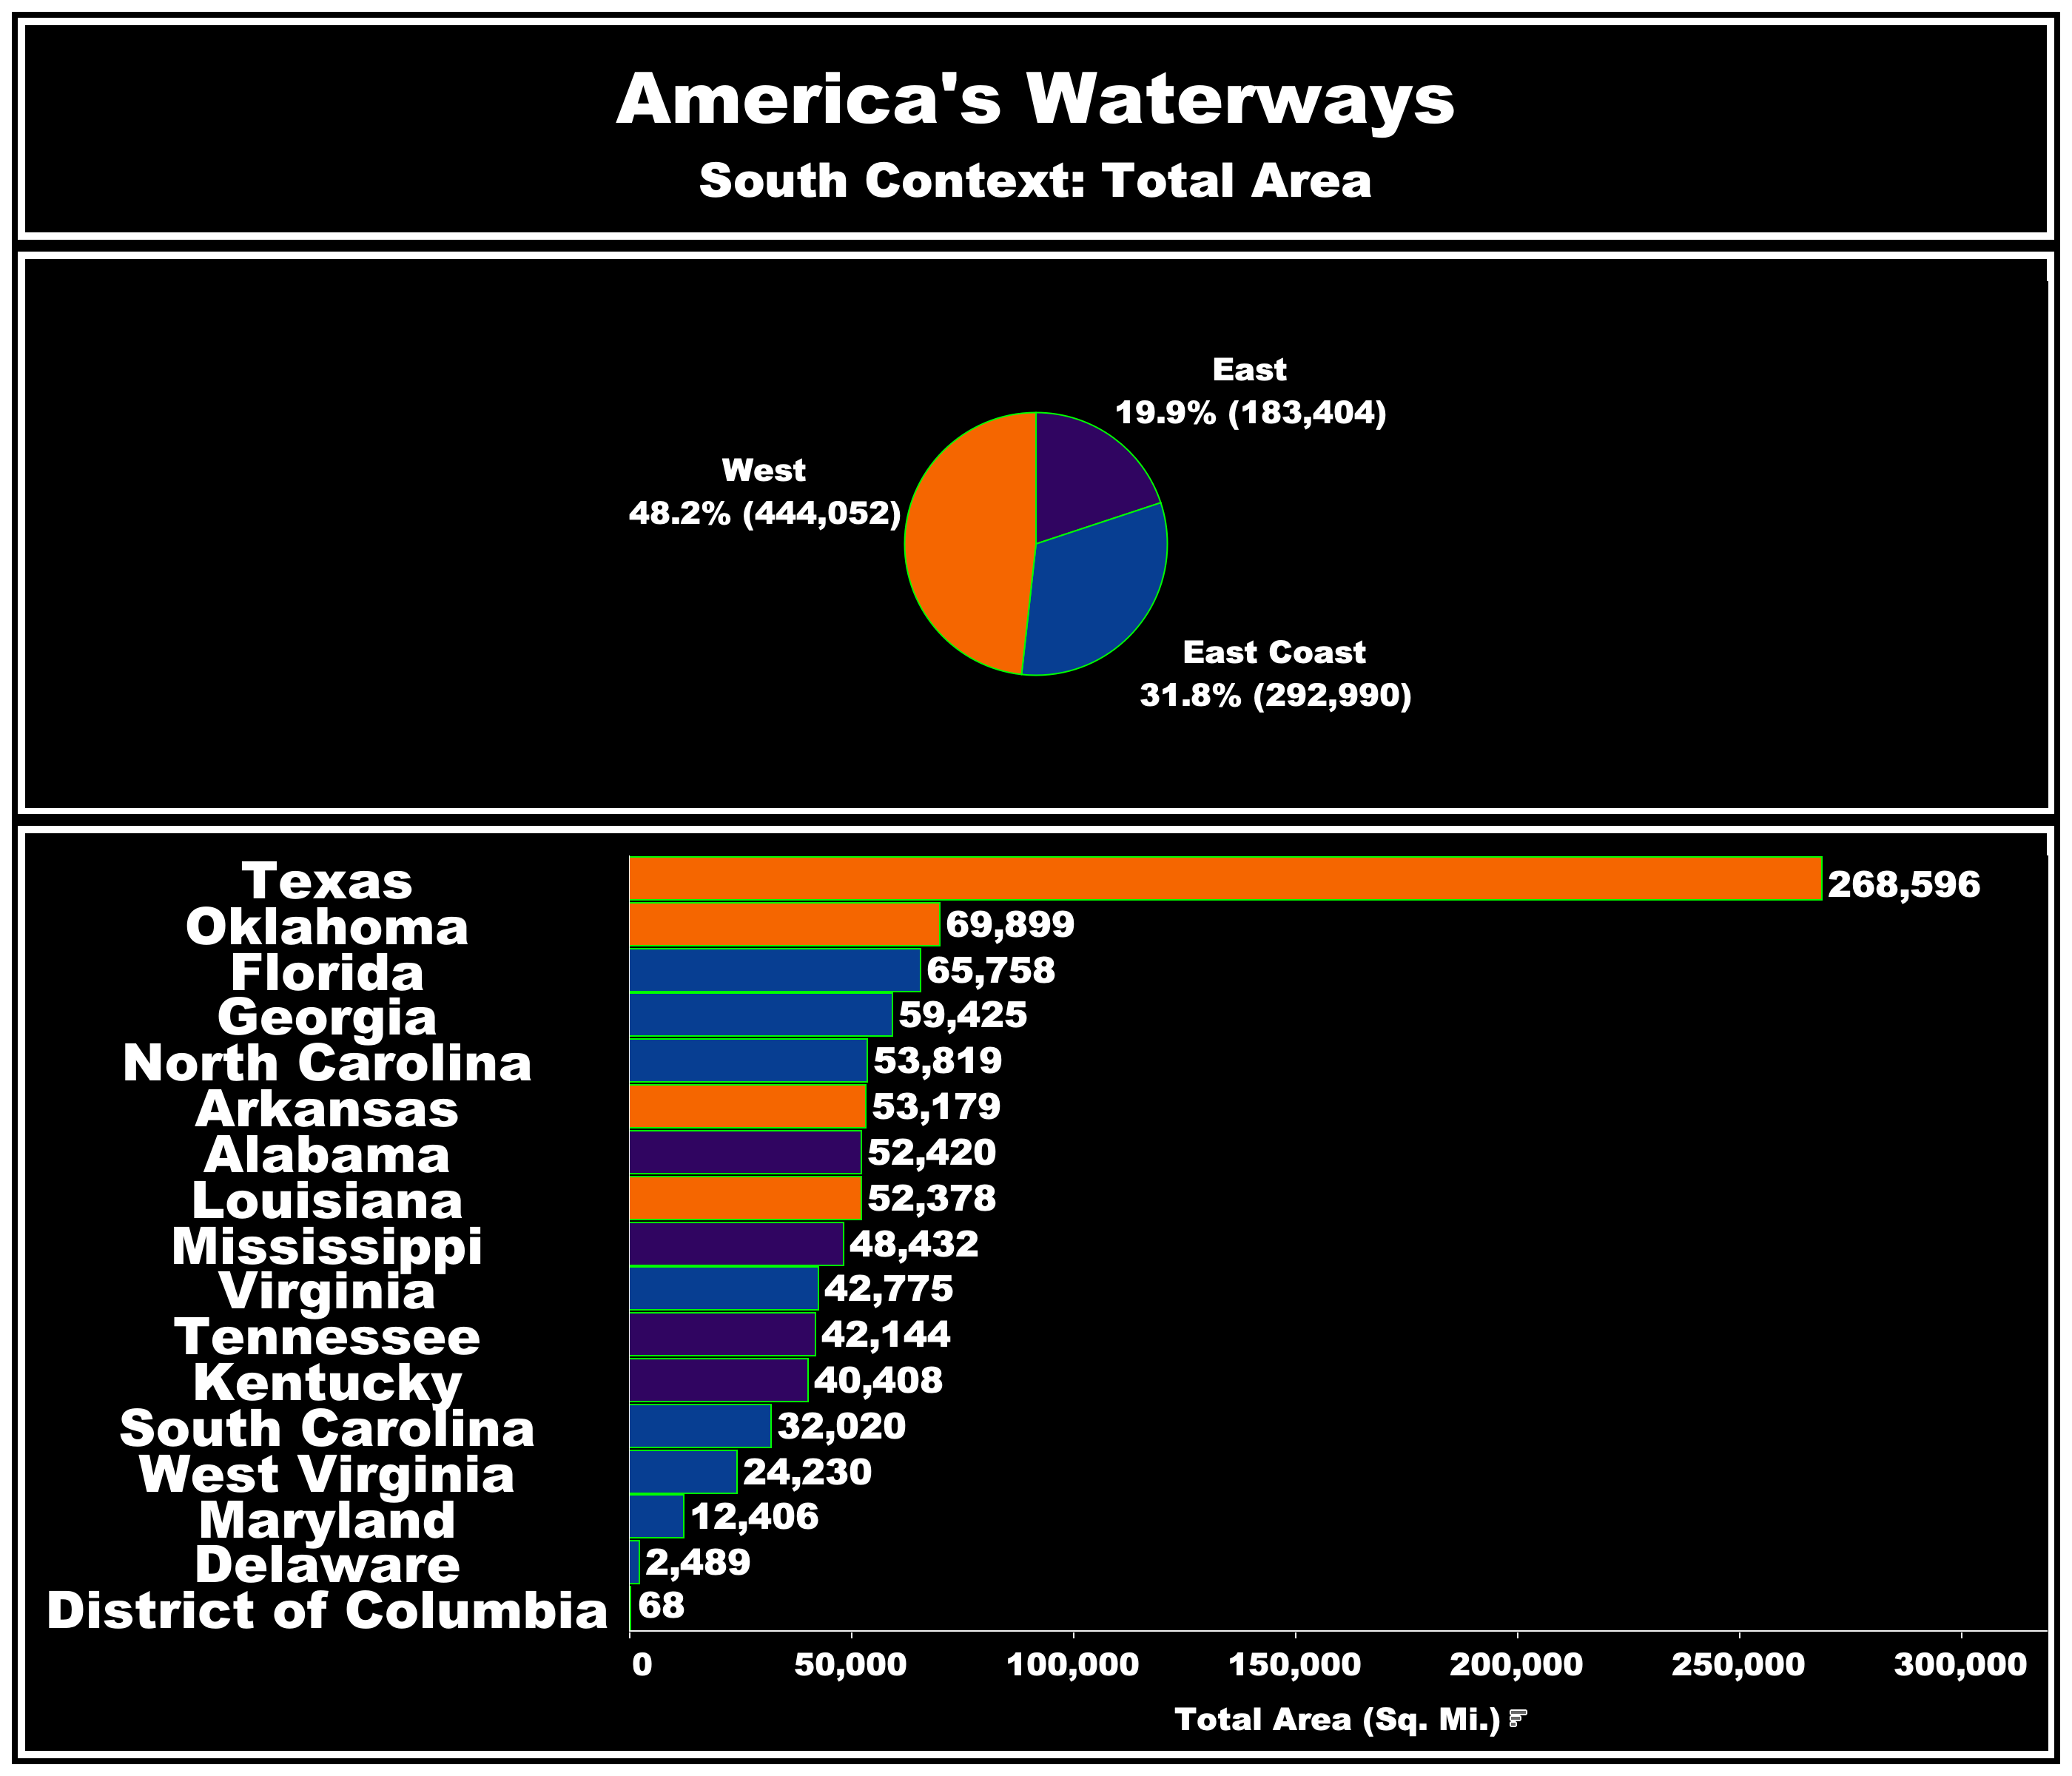
The South’s waterways are extremely important when it comes the nation’s economy. The region’s 17 states account for the entirety of the Gulf Coast as well as much of the commercially important Eastern Seaboard. The Census Bureau breaks the area into three divisions which can be helpful in understanding the waterway perspective.
West South Central (West)
Arkansas
Louisiana
Oklahoma
Texas
East South Central (East)
Alabama
Kentucky
Mississippi
Tennessee
South Atlantic (East Coast)
Delaware
Florida
Georgia
Maryland
North Carolina
South Carolina
Virginia
West Virginia
Washington, D.C.
Total Area
The south’s Western portion accounts for the bulk of the region’s total area. Texas is the big outlier but the four states in the West contain 444,052 square miles (48%) of the South’s total area.
Water Area
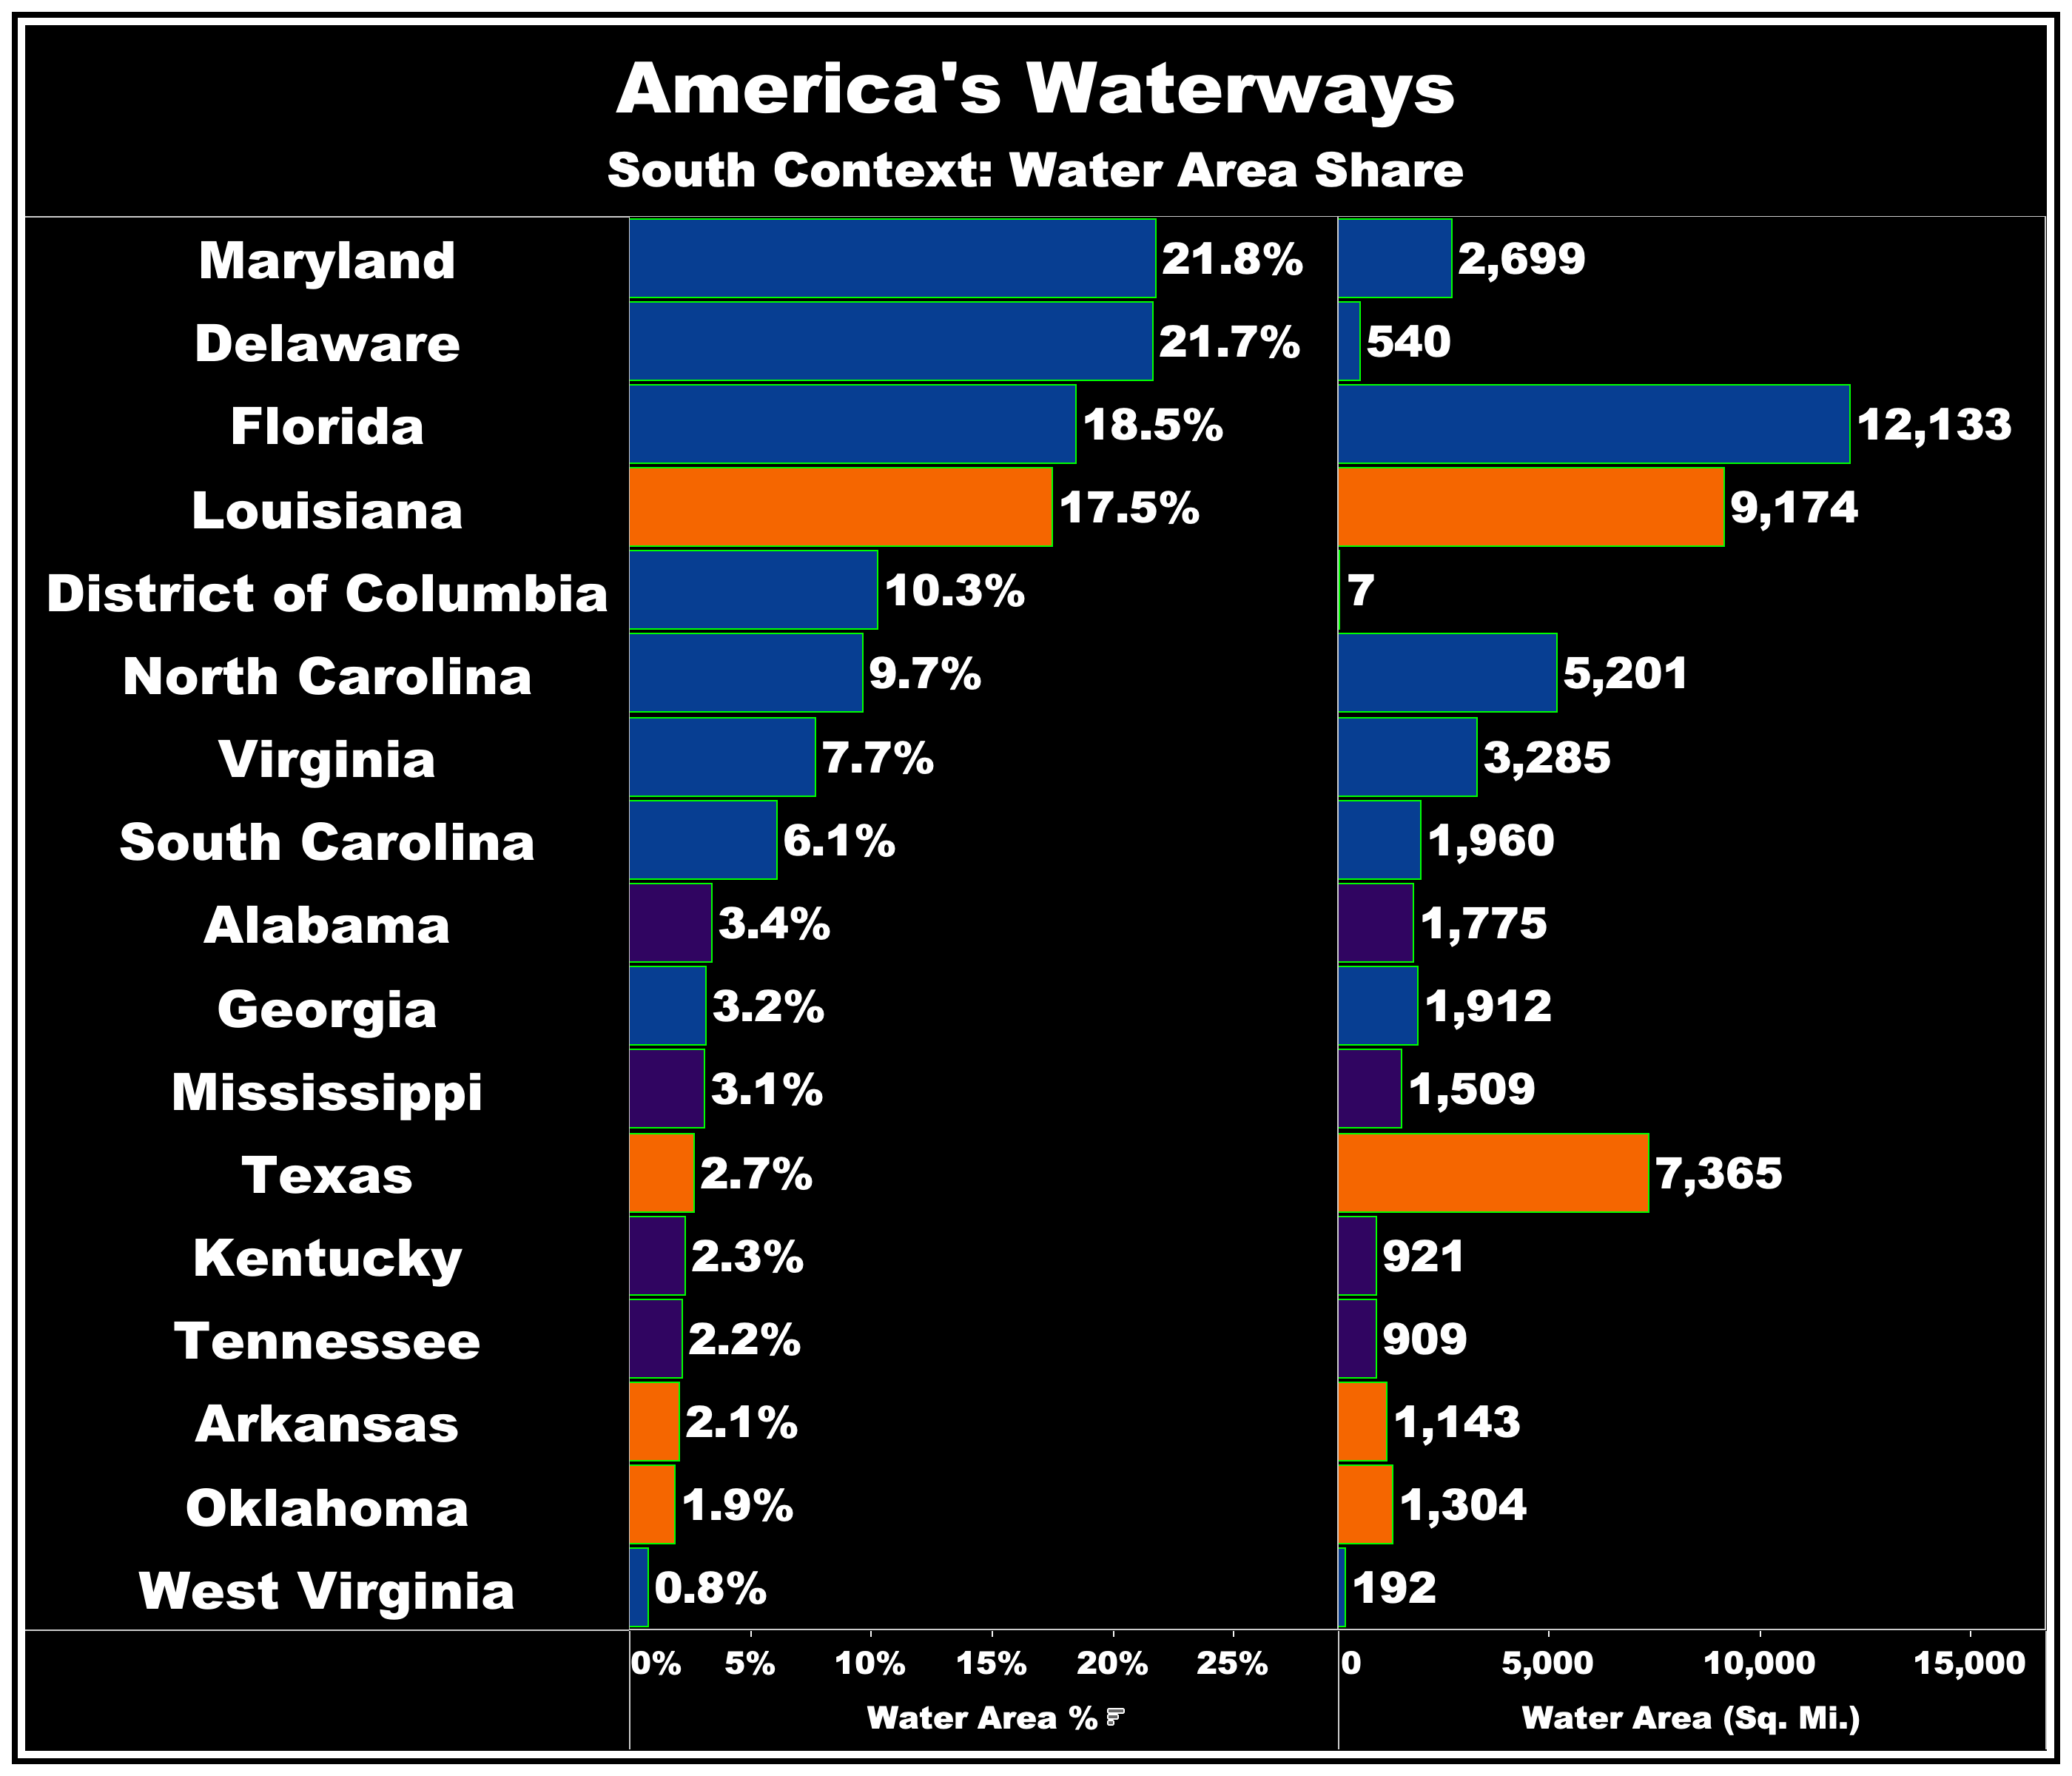
In terms of gross water area, Florida is the South’s standout state. There is an estimated 12,133 square miles of water area in Florida. Louisiana and Texas, over in the Western section, occupy the #2 and #3 spots. Louisiana has 9,174 square miles of water area and Texas has 7,365 square miles of water area. The East Coast’s North Carolina is another outlier, with 5,201 square miles of water area.
Overall, though, the East Coast is where you can find most of the South’s water area.

Water Area Share
East Coast
The water area share ranges from 0.8% to 21.8% at the state level for the East Coast division. West Virginia is the big outlier on the low end with only 192 square miles (0.8%) of its total area being water. Georgia (3.2%), South Carolina (6.1%) and Virginia (7.7%) are also on the low end of the spectrum. North Carolina and D.C. sit in a middle bucket with 9.7% and 10.3 of their respective area’s being water.
Florida has the most gross water area of all the Southern region and East Coast division’s states. But it’s third in terms of water share, with 18.5% of total area being water. Delaware (21.7%) and Maryland (21.8%) are almost dead even in terms of water share. But the two states are very different from a footprint perspective. Maryland has 2,699 square miles of water area and Delaware has 540 square miles of water area.
East
The South’s East division is notably lacking in water area. Alabama has the most 1,775 square miles followed by Mississippi with 1,509 square miles. These gross footprints account for between 3.1 and 3.4% of each state’s total area.
Kentucky and Tennessee have between 909 and 921 square miles of water area, representing approximately 2.3% of each state’s total area.
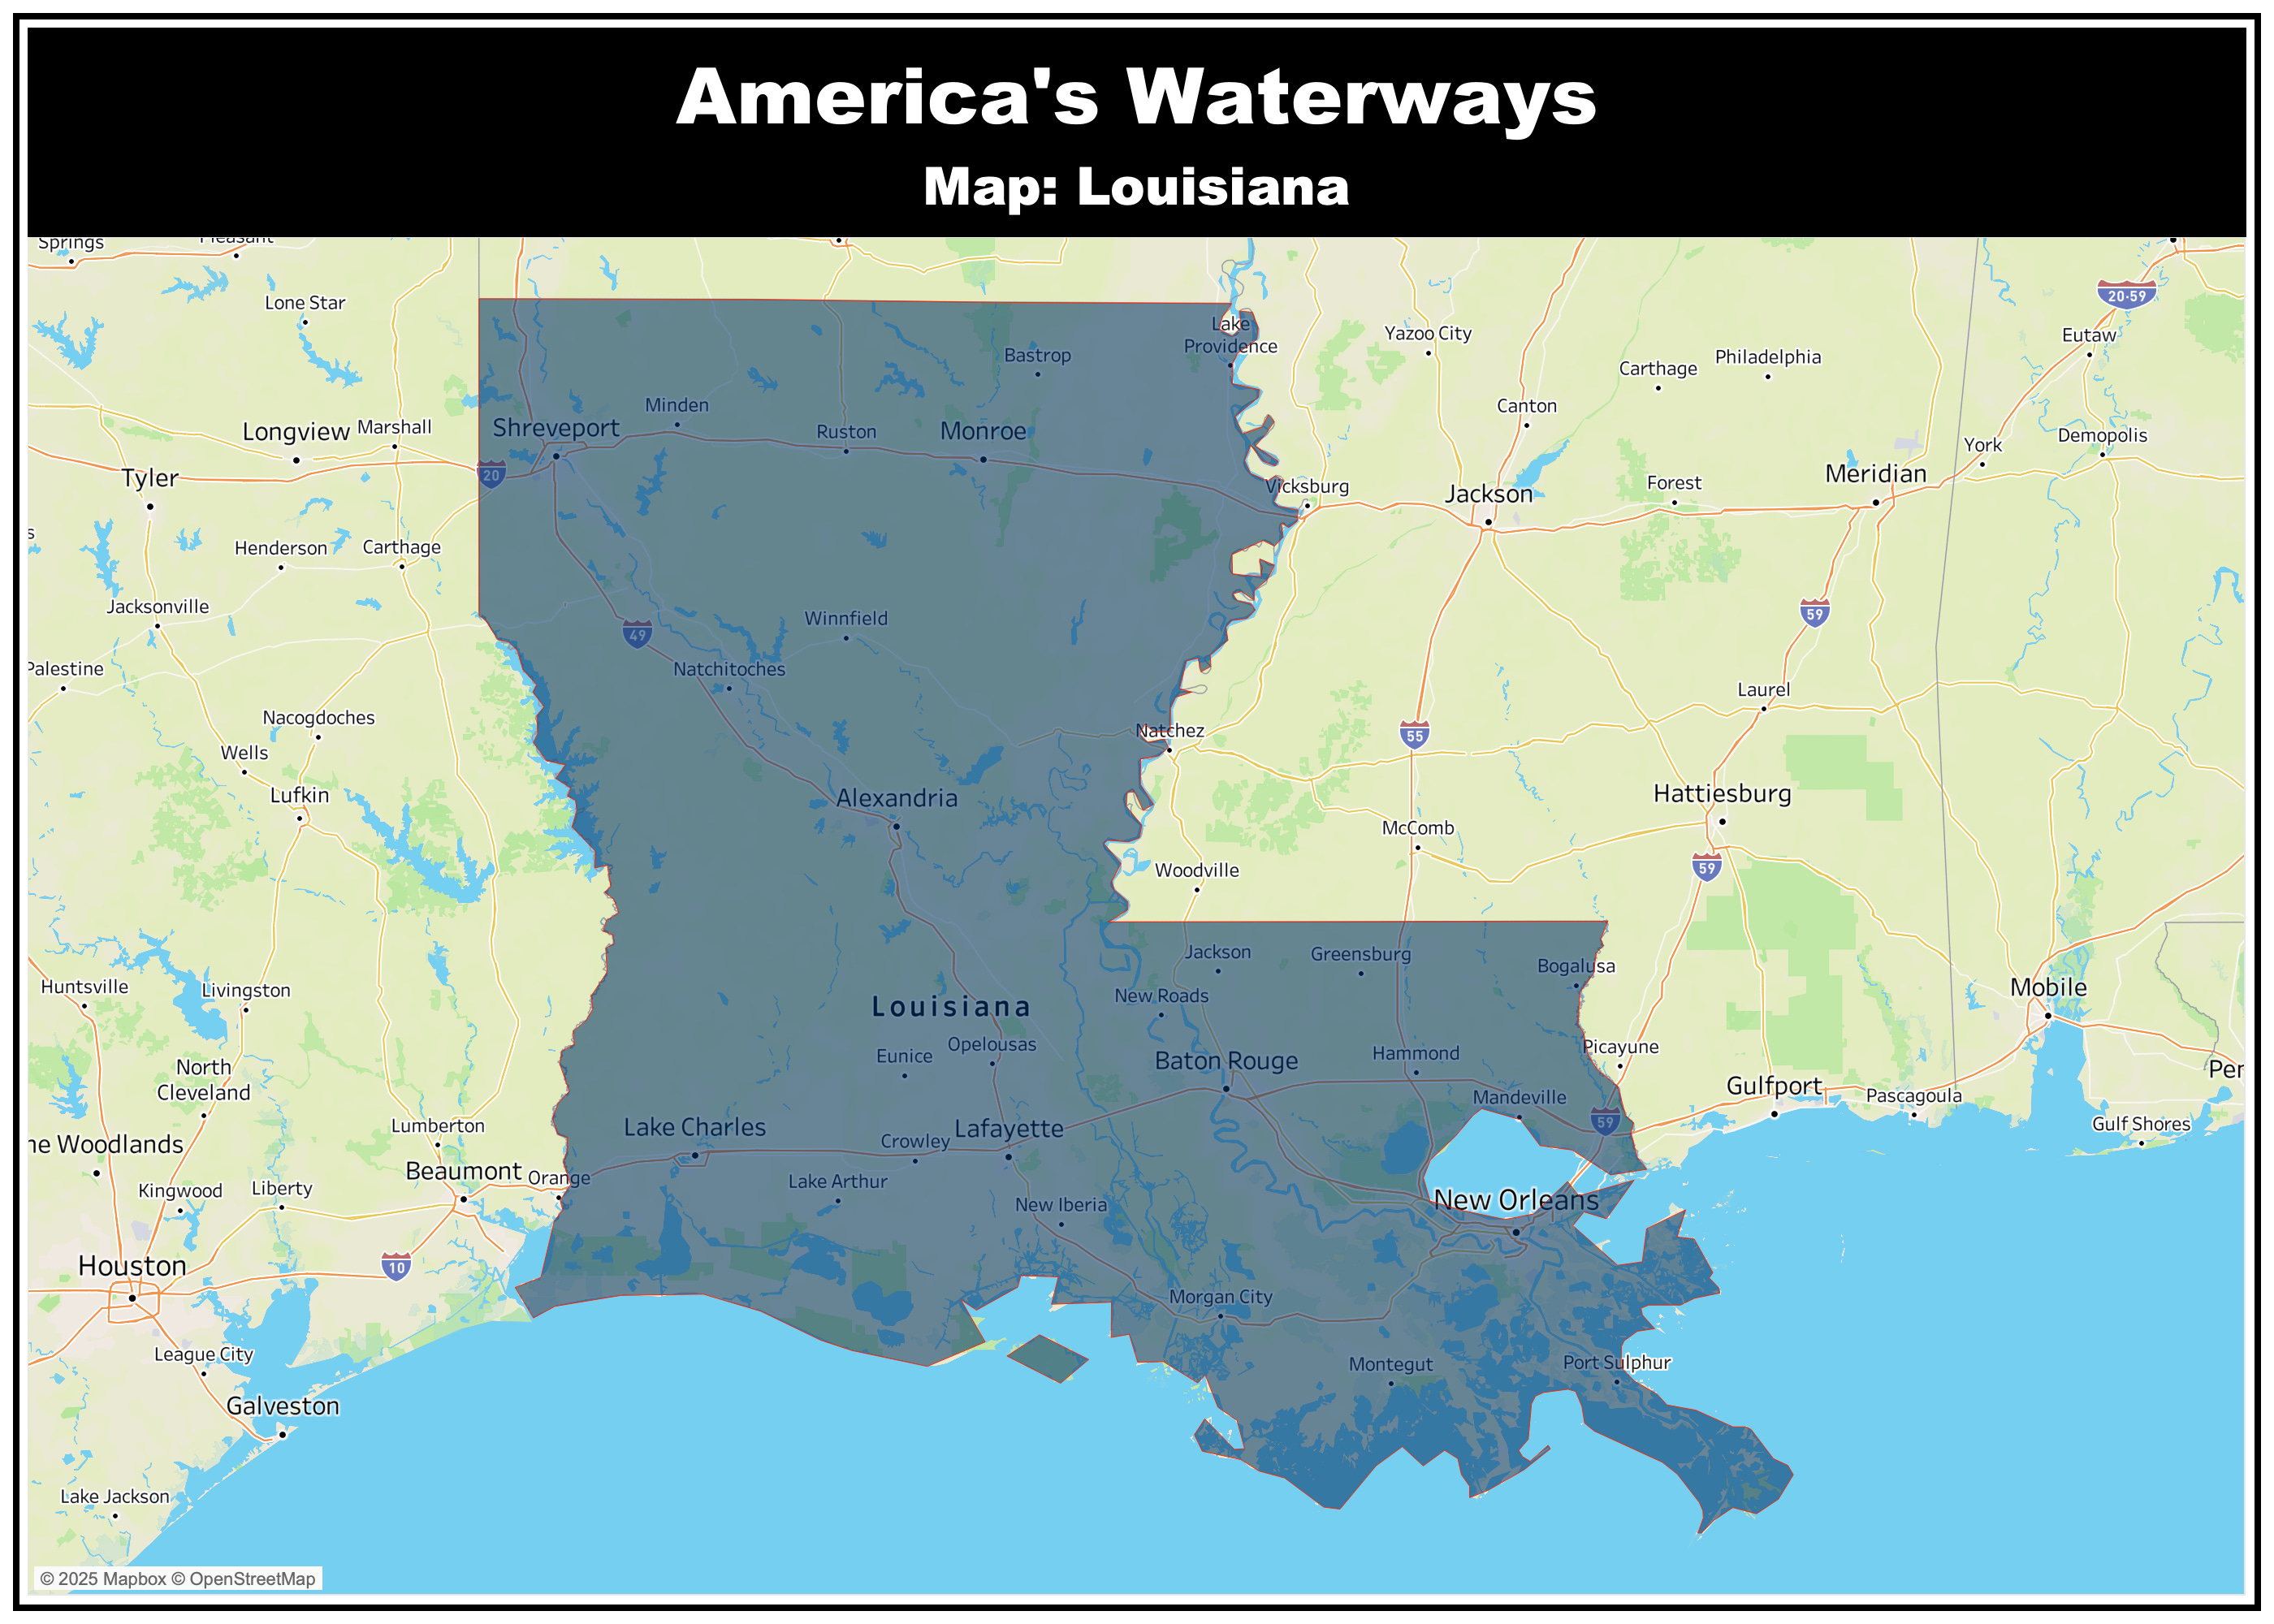
West
Louisiana is one of the South’s most interesting states in terms of waterways. It is the main reason that the region’s Western division accounts for such a large share of water area. The Sportsman’s Paradise has 9,714 square miles of water area, accounting for 17.5% of the state’s total area. Texas has 7,365 miles of water area but that only translates to 2.7% of the Lone Star State’s total area. The water area in Arkansas and Oklahoma ranges between 1,143 square miles and 1,304 square miles. Across both states, the rolls up to around a 2% water share.
And this context is particularly important as big events related to inland waterways, wetlands and maritime trade continue to unfold in Louisiana and the South more broadly.
Balancing Preservation and Economics
Last week the state government paused Louisiana’s work on the largest coastal restoration project, the Mid-Barataria Sediment Diversion. The project received federal permits in 2022 but funding mechanisms date back to the aftermath of the 2010 Gulf oil spill. The pause is work is very nuanced and based in what I believe are legitimate concerns about the means in which the long-delayed project will be funded given how much the economic, not considering environmental, landscape has changed.
In the same week, a judge ordered a historic $744 million in damages from Chevron to Louisiana’s Plaquemines parish for coastal wetland destruction. There are a lot of moving pieces that led up to the judgement and the puzzle will get even more complicated moving forward. But at a high-level, the court found that the oil company violated restoration regulations as it went about the business of dredging, drilling and conducting other activities related to making the waterways economically viable.
This is a particularly big deal for Louisiana. But the balance of preservation/restoration and the economic importance of America’s waterways is a topic with far-reaching implications.